Within a section, courses can be taught as an individual module or a series of modules for a more comprehensive multifaceted course. They are available on consecutive days or over a period time at designated frequency.


Formation Evaluation

Courses_Formation Evaluation_Scott_Frailey

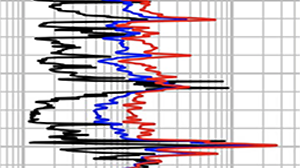
The courses focus on open hole well log analyses for the purpose of setting pipe, selecting the perorated interval, and behind pipe opportunity. The analyses and interpretation are presented in a simplistic and fundamental way that is easy to remember and use.

FE1: Qualitative Well Log Analyses: Expectations and Exceptions (Rules and Exceptions)

Selecting potentially productive intervals within formations requires effective porosity, oil saturation, and permeability. This module provides qualitative interpretation by looking at trends of a log with surrounding formations and trends between different logs. There is no permeability log so indications that invasion of mud filtrate has displaced near-wellbore oil is used as a proxy. Gamma ray, spontaneous potential, resistivity, resistivity profiles, neutron, density, and sonic logs are included. Examples are given for formations that confirm to the assumptions required for each logs, and how some oil productive formations that do not meet the assumptions can be overlooked.

FE2: Quantitative Basic Well Log Analyses

Porosity, oil saturation, and oil mobility is the essence of basic well log analysis. Collectively, these parameters are used to estimate net thickness, perforated interval, and oil in place, which impact the decision to set pipe on new wells or plug existing wells. The spontaneous potential and resistivity logs with gamma ray and at least one porosity tool is necessary. Calculations include: Archie and ratio water saturations, movable hydrocarbon index, neutron and density porosity, and resistivity derived porosity. Welbore and reservoirs that are ideal and give results directly are presented. Like all analyses, there are exceptions to ideal scenarios. Comparisons of these parameters will be discussed so that non-ideal scenarios can be diagnosed and useful log analyses can be made to make operational decisions. Several local examples will be presented. Emphasis will be given to importance of knowledge of lithology and pore type via petrography and cores to further reduce uncertainty in the well log analyses results.

FE3: Advanced Well Log Analyses: Carbonate Reservoirs-Porosity and Wettability Variations

Low porosity carbonates tend to require fractures to be productive. Moreover, low porosity carbonates require the porosity to be entirely connected. Unlike the density and neutron logs, which both detect total porosity, the sonic logs are more strongly indicative of the effective porosity only. Therefore, comparison of the sonic to the neutron-density average porosity is essential to identify low porosity carbonates that will be productive and those that will not. Resistivity derived porosity for the near and far wellbore based on the shallow and deep resistivity logs with the conventional porosity logs, further substantiates if the invasion of mud filtrate into the formation has displaced oil. Comparison of two water saturations are indicative of are indicative of the presence of wettability and microporosity which both can make oil productive zones appear wet and water zones look oil productive. Using this log analyses, you will be able to pick the intervals to perforate in large thick, carbonate sequences.

FE4: Advanced Well Log Analyses: Shaly Sands-Producing the “wet-looking” Oil Reservoirs

In oil productive formations, generally clays within sandstones cause traditional well log analyses to underestimate oil saturation and overestimate porosity. Because clays have bound water they appear conductive on resistivity logs. These are recognized as low-resistivity pay and are exception to the rule that oil reservoirs have high resistivity. The same water causes neutron logs to read too high. Depending on clay type, the density log may read high porosity or is unaffected. There are recognized analyses methods to correct for this effect so that an oil producing interval that looks and calculates wet on a well log can be correctly identified, perforated and produced. The Aux Vases in the Illinois Basin is recognized as a low resistivity pay interval.

FE5: When Log Analyses Fails: Rmf, Rw, Porosity Type, Wettability, and Lithology Assumptions

Well log analyses require several assumptions to hold true in order to use effectively analyses results to identify productive formations. This course reviews necessary assumptions required for routine log analyses and common situations which invalidate these assumptions. This leads to oil zones appearing wet and water zones appearing like oil zones on log analyses. Emphasis is placed on good data measured during the logging procedure and the value in analyzing cuttings. In many instances log interpretations are non-unique and other data types (e.g. water sample for water resistivity or petrography to identify porosity type) can resolve the interpretation.

FE6: Net Pay: Porosity, Permeability, and Flow Rate

 The entire or gross thickness of an oil or gas reservoir will most likely not produce fluids at economic rates.  Net pay or net thickness is that part of the gross thickness that will produce fluids into the wellbore. Several geologic features can separately or collectively control the difference between pay and non-pay: volume of shale, porosity type, and permeability, are examples of these features. Estimating net pay typically requires selection of a cutoff which a minimum or maximum value of a parameter, for example, porosity or volume of shale, are used. These can be based on regional or local accepted values or completely arbitrary.  They can be based on porosity logs and core data. Because of the availability of well log data available on the half or foot interval, most all cutoffs are tied to well logs. Depending on data available, use of statistical methods can be used to identify cutoff values for individual wells or a specific oil reservoir.


Well Performance: Production and Injection

Well_Performance- Production_Injection_courses_scott_fraileyThese courses are designed for studying individual wells in the context of comparative production/injection history of other wells in the field or area producing from similar formations.

WP1: Pressure, Perm, and Skin: Making the Most of Your Well

The production or injection rate of an individual well is controlled by reservoir pressure, permeability, and skin (near wellbore flow impediments or improvements). Workflow is developed and applied to systematically determine which of these three factors are attributable to “problem” wells so that a solution can be planned. Once wellbore tubular, pumps, rods, and pumping unit problems have been eliminated, focus can be given to the reservoir. If low reservoir pressure is determined the problem, then waterflood rates may be adjusted or a geologic study undertaken to determine if the offset injection well is completed in the same formation the producer is perforate. If skin is the cause, then further diaganoses are necessary to determine if a simple well cleanout is needed, an acid or fracture stimulation. If permeability is the cause, there is a little that can be done, and expensive wellbore stimulation treatments can be avoided to reduce unnecessary operating expenditures.

WP2: The Economics of Pressure Transient Testing: Part 1- Design

A pressure transient test is always an investment in acquiring data that leads to other actions that may increase oil production or avoid unnecessary field operations (e.g. a well stimulation). For those people practicing trial and error field efforts to increase oil production, pressure transient testing is seen as an unnecessary expense. In addition, some wells are more difficult to test and lead to inconclusive results; there instances when these should wells should not be tested. Unfortunately, poorly designed tests that lead to inconclusive results can lead to the stereotype of “pressure transient analyses doesn’t work in this field”, and “are a waste of money”. Identification of the challenges present of testing individual wells is a necessity, and outcome of a properly designed test is that it is unreasonable or too expensive to test the well. This class focusses on the elements of designing pressure buildup tests in oil and gas producing wells to meet test objectives and economic constraints of the test. Several design examples are given of successful and failed pressure build-up tests.

WP3 The Economics of Pressure Transient Testing: Part 1- Analysis

Most often, the design of a pressure transient test is to acquire pressure data responding to a period of time when the well “sees” the reservoir as “infinite-acting”. The first step in the analyses is to identify the infinite-acting period. This leads to estimates of the permeability, skin factor, and the average reservoir pressure. The compression of fluids and changing fluid levels in the wellbore can dominate the infinite-acting period. Likewise, geologic features (e.g. natural fractures, flow barriers, and layered reservoirs) can influence the measured pressure and challenge the analyses. If these features are known a priori, the design of the pressure transient test can overcome the influence of the features. However, if they are discovered as a consequence of the pressure transient test, the infinite-acting period may be elusive. Examples are presented of test analyses for different wellbore and geologic features that influenced test results. Included are the economic economic impact of the use of the test results to influence operational decisions.

WP4: Design of Pressure Falloff Tests: Diagnosing Your Underperforming Water Injection Well

 One of the objectives of many waterfloods is to inject water at high rates in order to accelerate oil production.  The injection rate depends on the reservoir permeability, skin factor, and average reservoir pressure.  A regularly scheduled pressure falloff test can provide all of this information.  The primary design consideration for a falloff test is the placement of the pressure gauges, the pre-test flow period of the well, and the duration of the test. The first step of analyses is to identify the flow periods to find the infinite-acting period that can be analyzed for permeability and skin. The Hall plot is a tool available to observe general trends in injection rate and pressure that may be indicative of changes to the flow properties of the well.  (See SE 3 for water injection falloff tests.)


Reservoir Engineering

reservoir_engineering_consulting_courses_scott_frailey


These courses are designed to provide understanding of concepts and approaches in a simple, practical way that is intuitive and usable following the course.  Some classes focus on basic ideas or entry level staff or those in another discipline interested in learning about reservoir engineering.

RE1: Reservoir Rock Properties

Watch / Subscribe to Course RE1  Porosity, permeability, saturation, and capillary pressure are rock properties that directly influence oil and water production and the volume of fluid that can be recovered. Factors that affect each of these is discussed in the context of carbonates and sandstones. Relationships between porosity, permeability, and saturation are used to estimate productivity of formations. Laboratory measurements of each is presented. Additional properties electrical resistivity, relative permeability, and residual saturation are directly part of most reservoirs or interpretations of well logs. Relationships between porosity, permeability, and saturation are used to estimate productivity of formations. Examples of reservoir problems using these parameters are shown, including interpretation of core analyses reports from commercial labs.

RE2: Reservoir Fluid Properties

Generally, reservoir fluids are either hydrocarbon or water. Hydrocarbons can be categorized as dry gas, wet gas, retrograde condensate, volatile oil and black oil. By categorizing fluids, unique approaches can be used to quantify each fluid type’s properties. The primary fluid properties are fluid formation volume factor, solution gas-liquid ratio, viscosity, and compressibility. Fluid properties can be estimated three different ways: laboratory measurements on a fluid sample, from composition using an equation of state, and correlations using readily available parameters (e.g. API gravity). Ranges of fluid properties for each hydrocarbon type are compared. Fluid properties are a strong function of  pressure; these trends are important to understand the development of producing properties and making long term plans to maximize oil production.  Demonstration and use of correlations to quantify fluid properties are shown. Methods for calculating fluid properties from commercial laboratory reports are given. 

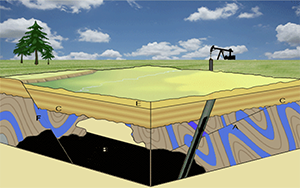
RE3: Understanding Reservoir Behavior: Reservoir Geology, Drive Mechanisms, Flow Unit, Oil Production and Recovery

Generally, oil moves from reservoirs to wells primarily through oil, gas, and/or water expansion as a consequence of the reduction in pressure the production well causes when pumping the well. The naturally occurring pressure of the oil is the dominant aspect that controls the longevity of the well unless water injection or a strong water aquifer is present. An assessment of the in situ drive mechanisms identifies the dominant sources of energy to drive oil from the reservoir. The permeability and pressure will determine the rate of pressure depletion and the longevity of the oil production well to sustain economic oil rates. One of the roles of the reservoir engineer is to maximize oil production while minimizing pressure depletion. Maintaining reservoir pressure most often maximizing long term oil recovery, but does not necessarily maximize daily oil production. Consequently, economic considerations usually influence the decision to produce at high rates and reduce recovery, or produce at reduced rates, and increase recovery. Identification of flow units using log and core data, and knowledge of the reservoir geology in terms of vertical and lateral continuity are important to fully understand reservoir behavior.

RE4: Waterflooding Basics

Waterflooding is by far the most commonly accepted and time-tested means of increasing oil production beyond primary production. It is recognized as low cost and relatively simple to design, permit, and deploy. At the very root of all waterfloods is simultaneously movement of oil and water in the same pore space of the rock. Relative permeability represents the effectiveness of water and oil moving in the same roc and ultimately how much oil can be recovered by water injection. Alternatively, end point residual oil saturation from core flood can be indicative of the volume oil potentially producible based on current and initial oil saturation. Water injection increases oil production primarily because pressure is increased between injectors and producers and a pressure gradient causes increased fluid flow rates from the water contacted areas of the reservoirs. The importance of understanding geologic features that govern interwell fluid flow with respect patter shape, size, and alignment and the perforated interval are discussed.

RE5: Troubleshooting Well and Pattern Performance: Use of Simple Reservoir Models

 Ideally, the response of a production well surrounded by injection wells is that for every barrel of fluid injected, a barrel of fluid is produced. Unfortunately, ideal pattern behavior is rare due to many factors: geologic heterogeneity and individual well flow behavior (i.e. skin factor). Geologic heterogeneity includes lateral connectivity from wells in the pattern, permeability anisotropy (x-y), and layers with differing permeability.To identify those patterns that are under performing, can be identified by comparing similar patterns to each other and to an expected or average trend determined by using analytical, numerical, and analogs. A common plot used is cumulative oil production vs. cumulative injected fluid, which is typically normalized to the hydrocarbon pore volume on a reservoir pressure basis. The challenge in surveying pattern performance conclusively is determining the cause of underperforming wells. Individual wells performance can be assessed with pressure transient tests and well stimulations.  Once the geologic feature attributed to cause pattern performance is identified, pattern size, pattern type, pattern realignment, and selective perforations can improve production.

RE6: CO2 EOR

One of the most common enhanced oil recovery methods is CO2 injection. This was primarily the case because of the availability of naturally occurring CO2 in the subsurface in proximity of the Permian Basin oi producing province. CO2, when in contact with oil, has the potential to mix with the oil. This mixture swells which creates a pressure gradient towards producers. Additionally, the CO2-enriched oil has lower viscosity and surface tension, thereby mobilizing oil that may not been mobile in the presence of water. Rules of thumb for predicting CO2 EOR based on volumetrics are given. Also, simply scoping tools that predicted CO2 usage and EOR as a function of time are used in examples that include simple economics. Like all subsurface operations, CO2 EOR has operational challenges, but with proper planning and surveillance they can be eliminated or minimized.


Storage engineering

storage_engineering_courses_scott_fraileyThese courses are designed to be applicable to CO2 and natural gas storage well work and project work.  The classes include general interest topics on reservoir and production engineering.

SE1: Classification of Storage Capacity and Resources

For site screening and selection, estimates of the CO2 storage is a necessary and important consideration. When outside funding is required or if CO2 storage is mandated, 3rd parties may require audit of storage quantities and potential for storage. In 2017, the Society of Petroleum Engineers developed a Storage Resource Management System that can be followed when estimating and reporting storage internally or externally. The primary classifications are Storage Resources and Storage Capacity, which reflect the degree of certainty in the estimate and the likelihood that a specific injection project plan is implemented through active injection. Several examples of categorization and classification of CO2 storage are given using data from recognized storage projects from around the world.

SE2: Design of a CO2 Storage Site: Site Screening, Selection, Design, and Operations

Learn all of the most important engineering and geological aspects of CO2 storage when considering locating an injection well and affiliated equipment. This course covers all aspects and stages of designing a CO2 storage site. The design criteria of an injection site e.g. the daily injection rate and ultimate CO2 storage quantity of a project. However, the design criteria will change as the maturity of the project changes. Flexibility in the design is necessary so that final design can meet the evolving project design criteria. Detailed designs will be presented in the context of examples from real projects, which include injection rates, injection pressures, and wellbore monitoring options. This courses finishes with injection startup procedures that provide baseline data which can be used to monitor injection performance for the life of the well.

SE3: Injection Well Testing: Maintaining Well Injectivity

 For all storage projects, maintaining target injection rates at the lowest injection pressure is practiced commonly.  Injection wells will be either pressure or rate constrained. The injection rate depends on the reservoir permeability, skin factor, and average reservoir pressure. A regularly scheduled pressure falloff test can provide all of this information.  The primary design consideration for a falloff test is the placement of the pressure gauges, the pre-test flow period of the well, and the duration of the test. For gas injection wells, the fluid in the injection tubing is highly compressible compared to water injection; therefore, the effect of wellbore gas compression may dominate the response of the reservoir, a critical aspect of any falloff test. For the analyses of the test, the first step of analyses is to identify the flow periods to find the infinite-acting period that can be analyzed for permeability and skin. Depending and changes with the wellbore fluid’s density, instances when surface pressure may be used are discussed. .  (See WP 3 for water injection falloff tests.) 

SE4: Reservoir Engineering Aspects of CO2 Storage

There are many aspects of CO2 storage that are directly related to natural gas storage and oil and gas production. Consequently, many reservoir engineering concepts, tools, and tests are directly applicable or analogous to CO2 storage. In site screening and site selection, volumetrics are used with assumptions on average CO2 saturation to provide a hierarchy of sites based on storage resources at different sites. The site selection process includes projections of daily injection rate and injection pressure to meet project requirements of single or group of CO2 sources. During the completion of the injection well, step rate tests and injection falloff tests will be used to further ensure injection rats and pressures will meet project needs. During active injection, pressure-rate-time relationships can be used to predict continued and longevity of the well and the site. The distribution of the CO2 plume and far-field pressure increases are predicted using simple volumetric and pressure transient relationships. These analyses and predictions will ensure compliance with the injection permit and project objectives so that active operations can be continued.